Monitoring
There are two ways to monitor Celeborn cluster: Prometheus metrics and REST API.
Metrics
Celeborn has a configurable metrics system based on the
Dropwizard Metrics Library.
This allows users to report Celeborn metrics to a variety of sinks including HTTP, JMX, CSV
files and prometheus servlet. The metrics are generated by sources embedded in the Celeborn code base.
They provide instrumentation for specific activities and Celeborn components.
The metrics system is configured via a configuration file that Celeborn expects to be present
at $CELEBORN_HOME/conf/metrics.properties. A custom file location can be specified via the
celeborn.metrics.conf configuration property.
Instead of using the configuration file, a set of configuration parameters with prefix
celeborn.metrics.conf. can be used.
Celeborn's metrics are divided into two instances corresponding to Celeborn components. The following instances are currently supported:
master: The Celeborn cluster master process.worker: The Celeborn cluster worker process.
Each instance can report to zero or more sinks. Sinks are contained in the
org.apache.celeborn.common.metrics.sink package:
CsvSink: Exports metrics data to CSV files at regular intervals.PrometheusServlet: Adds a servlet within the existing Celeborn REST API to serve metrics data in Prometheus format.JsonServlet: Adds a servlet within the existing Celeborn REST API to serve metrics data in JSON format.GraphiteSink: Sends metrics to a Graphite node.JmxSink: Registers metrics for viewing in a JMX console.LoggerSink: Scrape metrics periodically and output them to the logger files if you have enabledceleborn.metrics.loggerSink.output.enabled. This is used as safety valve to make sure the metrics data won't exist in the memory for a long time. If you don't have a metrics collector to collect metrics from celeborn periodically, it's important to enable this sink.
The syntax of the metrics configuration file and the parameters available for each sink are defined
in an example configuration file,
$CELEBORN_HOME/conf/metrics.properties.template.
When using Celeborn configuration parameters instead of the metrics configuration file, the relevant
parameter names are composed by the prefix celeborn.metrics.conf. followed by the configuration
details, i.e. the parameters take the following form:
celeborn.metrics.conf.[instance|*].sink.[sink_name].[parameter_name].
This example shows a list of Celeborn configuration parameters for a CSV sink:
"celeborn.metrics.conf.*.sink.csv.class"="org.apache.celeborn.common.metrics.sink.CsvSink"
"celeborn.metrics.conf.*.sink.csv.period"="1"
"celeborn.metrics.conf.*.sink.csv.unit"=minutes
"celeborn.metrics.conf.*.sink.csv.directory"=/tmp/
Default values of the Celeborn metrics configuration are as follows:
*.sink.prometheusServlet.class=org.apache.celeborn.common.metrics.sink.PrometheusServlet
*.sink.jsonServlet.class=org.apache.celeborn.common.metrics.sink.JsonServlet
*.sink.loggerSink.class=org.apache.celeborn.common.metrics.sink.LoggerSink
Additional sources can be configured using the metrics configuration file or the configuration
parameter celeborn.metrics.conf.[component_name].source.jvm.class=[source_name]. At present the
no source is the available optional source. For example the following configuration parameter
activates the Example source:
"celeborn.metrics.conf.*.source.jvm.class"="org.apache.celeborn.common.metrics.source.ExampleSource"
Available metrics providers
Metrics used by Celeborn are of multiple types: gauge, counter, histogram, meter and timer,
see Dropwizard library documentation for details.
The following list of components and metrics reports the name and some details about the available metrics,
grouped per component instance and source namespace.
The most common time of metrics used in Celeborn instrumentation are gauges and counters.
Counters can be recognized as they have the .count suffix. Timers, meters and histograms are annotated
in the list, the rest of the list elements are metrics of type gauge.
The large majority of metrics are active as soon as their parent component instance is configured,
some metrics require also to be enabled via an additional configuration parameter, the details are
reported in the list.
Master
These metrics are exposed by Celeborn master.
-
namespace=master
Metric Name Description RegisteredShuffleCount The count of registered shuffle. DeviceCelebornFreeBytes The actual usable space of Celeborn available workers for device. DeviceCelebornTotalBytes The total space of Celeborn for device. RunningApplicationCount The count of running applications. ActiveShuffleSize The active shuffle size of workers. ActiveShuffleFileCount The active shuffle file count of workers. ShuffleTotalCount The total count of shuffle including celeborn shuffle and engine built-in shuffle. ShuffleFallbackCount The count of shuffle fallbacks. ApplicationTotalCount The total count of application running with celeborn shuffle and engine built-in shuffle. ApplicationFallbackCount The count of application fallbacks. WorkerCount The count of active workers. LostWorkerCount The count of workers in lost list. ExcludedWorkerCount The count of workers in excluded list. AvailableWorkerCount The count of workers in available list. ShutdownWorkerCount The count of workers in shutdown list. DecommissionWorkerCount The count of workers in decommission list. IsActiveMaster Whether the current master is active. RatisApplyCompletedIndex The ApplyCompletedIndex of the current master node in HA mode. RatisApplyCompletedIndexDiff The difference value of ApplyCompletedIndex of the master nodes in HA mode. PartitionSize The size of estimated shuffle partition. OfferSlotsTime The time for masters to handle RequestSlotsrequest when registering shuffle.RequestSlotsFailed The count of failed RequestSlotsrequests, labeled by the failure status code. -
namespace=CPU
Metric Name Description JVMCPUTime The JVM costs cpu time. -
namespace=system
Metric Name Description LastMinuteSystemLoad The average system load for the last minute. AvailableProcessors The amount of system available processors. -
namespace=JVM
- This source provides information on JVM metrics using the Dropwizard/Codahale Metric Sets for JVM instrumentation and in particular the metric sets BufferPoolMetricSet, GarbageCollectorMetricSet and MemoryUsageGaugeSet.
-
namespace=ResourceConsumption
- notes:
- This metrics data is generated for each user and they are identified using a metric tag.
- This metrics also include subResourceConsumptions generated for each application of user and they are identified using
applicationIdtag.
Metric Name Description diskFileCount The count of disk files consumption by each user. diskBytesWritten The amount of disk files consumption by each user. hdfsFileCount The count of hdfs files consumption by each user. hdfsBytesWritten The amount of hdfs files consumption by each user. - notes:
-
namespace=ThreadPool
- notes:
- This metrics data is generated for each thread pool and they are identified using a metric tag by thread pool name.
Metric Name Description active_thread_count The approximate number of threads that are actively executing tasks. pending_task_count The pending task not executed in block queue. pool_size The current number of threads in the pool. core_pool_size The core number of threads. maximum_pool_size The maximum allowed number of threads. largest_pool_size The largest number of threads that have ever simultaneously been in the pool. is_terminating Whether this executor is in the process of terminating after shutdown() or shutdownNow() but has not completely terminated. is_terminated Whether this executor is in the process of terminated after shutdown() or shutdownNow() and has completely terminated. is_shutdown Whether this executor is shutdown. thread_count The thread count of current thread group. thread_is_terminated_count The terminated thread count of current thread group. thread_is_shutdown_count The shutdown thread count of current thread group. - notes:
Worker
These metrics are exposed by Celeborn worker.
-
namespace=worker
Metric Name Description RegisteredShuffleCount The count of registered shuffle. RunningApplicationCount The count of running applications. ActiveShuffleSize The active shuffle size of a worker including master replica and slave replica. ActiveShuffleFileCount The active shuffle file count of a worker including master replica and slave replica. OpenStreamTime The time for a worker to process openStream RPC and return StreamHandle. FetchMemoryChunkTime The time for a worker to fetch a memory chunk which is 8MB by default from a reduced partition. FetchLocalChunkTime The time for a worker to fetch a local disk chunk which is 8MB by default from a reduced partition. FetchChunkTransferTime The time for a worker to transfer for fetching a chunk from a reduced partition. ActiveChunkStreamCount Active stream count for reduce partition reading streams. OpenStreamSuccessCount The count of opening stream succeed in current worker. OpenStreamFailCount The count of opening stream failed in current worker. FetchMemoryChunkSuccessCount The count of fetching memory chunk succeed in current worker. FetchLocalChunkSuccessCount The count of fetching local disk chunk succeed in current worker. FetchMemoryChunkFailCount The count of fetching memory chunk failed in current worker. FetchLocalChunkFailCount The count of fetching local disk chunk failed in current worker. FetchChunkTransferSize The size of transfer for fetching chunk in current worker. PrimaryPushDataTime The time for a worker to handle a pushData RPC sent from a celeborn client. ReplicaPushDataTime The time for a worker to handle a pushData RPC sent from a celeborn worker by replicating. PrimarySegmentStartTime The time for a worker to handle a segmentStart RPC sent from a celeborn client. ReplicaSegmentStartTime The time for a worker to handle a segmentStart RPC sent from a celeborn worker by replicating. WriteDataHardSplitCount The count of writing PushData or PushMergedData to HARD_SPLIT partition in current worker. WriteDataSuccessCount The count of writing PushData or PushMergedData succeed in current worker. WriteDataFailCount The count of writing PushData or PushMergedData failed in current worker. ReplicateDataFailCount The count of replicating PushData or PushMergedData failed in current worker. ReplicateDataWriteFailCount The count of replicating PushData or PushMergedData failed caused by write failure in peer worker. ReplicateDataCreateConnectionFailCount The count of replicating PushData or PushMergedData failed caused by creating connection failed in peer worker. ReplicateDataConnectionExceptionCount The count of replicating PushData or PushMergedData failed caused by connection exception in peer worker. ReplicateDataFailNonCriticalCauseCount The count of replicating PushData or PushMergedData failed caused by non-critical exception in peer worker. ReplicateDataTimeoutCount The count of replicating PushData or PushMergedData failed caused by push timeout in peer worker. PushDataHandshakeFailCount The count of PushDataHandshake failed in current worker. RegionStartFailCount The count of RegionStart failed in current worker. RegionFinishFailCount The count of RegionFinish failed in current worker. SegmentStartFailCount The count of SegmentStart failed in current worker. PrimaryPushDataHandshakeTime PrimaryPushDataHandshake means handle PushData of primary partition location. ReplicaPushDataHandshakeTime ReplicaPushDataHandshake means handle PushData of replica partition location. PrimaryRegionStartTime PrimaryRegionStart means handle RegionStart of primary partition location. ReplicaRegionStartTime ReplicaRegionStart means handle RegionStart of replica partition location. PrimaryRegionFinishTime PrimaryRegionFinish means handle RegionFinish of primary partition location. ReplicaRegionFinishTime ReplicaRegionFinish means handle RegionFinish of replica partition location. PausePushDataStatus The status for a worker to stop receiving pushData from clients because of back pressure. PausePushDataTime The time for a worker to stop receiving pushData from clients because of back pressure. PausePushDataAndReplicateTime The time for a worker to stop receiving pushData from clients and other workers because of back pressure. PausePushDataAndReplicateStatus The status for a worker to stop receiving pushData from clients because of back pressure. PausePushData The count for a worker to stop receiving pushData from clients because of back pressure. PausePushDataAndReplicate The count for a worker to stop receiving pushData from clients and other workers because of back pressure. PartitionFileSizeBytes The size of partition files committed in current worker. TakeBufferTime The time for a worker to take out a buffer from a disk flusher. FlushLocalDataTime The time for a worker to write a buffer to local storage. FlushHdfsDataTime The time for a worker to write a buffer to hdfs storage. FlushOssDataTime The time for a worker to write a buffer to oss storage. FlushS3DataTime The time for a worker to write a buffer to s3 storage. CommitFilesTime The time for a worker to flush buffers and close files related to specified shuffle. CommitFilesFailCount The count of commit files request failed in current worker. SlotsAllocated Slots allocated in last hour. ActiveSlotsCount The number of slots currently being used in a worker. ReserveSlotsTime ReserveSlots means acquire a disk buffer and record partition location. ActiveConnectionCount The count of active network connection. NettyMemory The total amount of off-heap memory used by celeborn worker. SortTime The time for a worker to sort a shuffle file. SortMemory The memory used by sorting shuffle files. SortingFiles The count of sorting shuffle files. PendingSortTasks The count of sort tasks waiting to be submitted to FileSorterExecutors. SortedFiles The count of sorted shuffle files. SortedFileSize The count of sorted shuffle files 's total size. DiskBuffer The memory occupied by pushData and pushMergedData which should be written to disk. BufferStreamReadBuffer The memory used by credit stream read buffer. ReadBufferDispatcherRequestsLength The queue size of read buffer allocation requests. ReadBufferAllocatedCount Allocated read buffer count. AvailableReadBuffer The available memory for credit stream read buffer. ReadBufferUsageRatio Ratio of credit stream read buffer used and max direct memory. ActiveCreditStreamCount Active stream count for map partition reading streams. ActiveMapPartitionCount The count of active map partition reading streams. SorterCacheHitRate The cache hit rate for worker partition sorter index. CleanTaskQueueSize The count of task for cleaning up expired shuffle keys. CleanExpiredShuffleKeysTime The time for a worker to clean up shuffle data of expired shuffle keys. DeviceOSFreeBytes The actual usable space of OS for device monitor. DeviceOSTotalBytes The total usable space of OS for device monitor. DeviceCelebornFreeBytes The actual usable space of Celeborn for device. DeviceCelebornTotalBytes The total space of Celeborn for device. PotentialConsumeSpeed The speed of potential consumption for congestion control. UserProduceSpeed The speed of user production for congestion control. WorkerConsumeSpeed The speed of worker consumption for congestion control. IsDecommissioningWorker 1 means worker decommissioning, 0 means not decommissioning. IsHighWorkload 1 means worker high workload, 0 means not high workload. UnreleasedShuffleCount Unreleased shuffle count when worker is decommissioning. UnreleasedPartitionLocationCount Unreleased partition location count when worker is shutting down. MemoryStorageFileCount The count of files in Memory Storage of a worker. MemoryFileStorageSize The total amount of memory used by Memory Storage. EvictedFileCount The count of files evicted from Memory Storage to Disk. EvictedLocalFileCount The count of files evicted from Memory Storage to LocalDisk. EvictedDfsFileCount The count of files evicted from Memory Storage to Dfs. DirectMemoryUsageRatio Ratio of direct memory used and max direct memory. RegisterWithMasterFailCount The count of failures in register with master request. FlushWorkingQueueSize The size of flush working queue for mount point. LocalFlushCount The amount of data flushed to local. LocalFlushSize The size of data flushed to local. HdfsFlushCount The amount of data flushed to HDFS. HdfsFlushSize The size of data flushed to HDFS. OssFlushCount The amount of data flushed to OSS. OssFlushSize The size of data flushed to OSS. S3FlushCount The amount of data flushed to S3. S3FlushSize The size of data flushed to S3. MetadataOperationStatusCount The count of metadata DB operations performed by the worker push_usedHeapMemory push_usedDirectMemory push_numHeapArenas push_numDirectArenas push_tinyCacheSize push_smallCacheSize push_normalCacheSize push_numThreadLocalCaches push_chunkSize push_numAllocations push_numTinyAllocations push_numSmallAllocations push_numNormalAllocations push_numHugeAllocations push_numDeallocations push_numTinyDeallocations push_numSmallDeallocations push_numNormalDeallocations push_numHugeDeallocations push_numActiveAllocations push_numActiveTinyAllocations push_numActiveSmallAllocations push_numActiveNormalAllocations push_numActiveHugeAllocations push_numActiveBytes replicate_usedHeapMemory replicate_usedDirectMemory replicate_numHeapArenas replicate_numDirectArenas replicate_tinyCacheSize replicate_smallCacheSize replicate_normalCacheSize replicate_numThreadLocalCaches replicate_chunkSize replicate_numAllocations replicate_numTinyAllocations replicate_numSmallAllocations replicate_numNormalAllocations replicate_numHugeAllocations replicate_numDeallocations replicate_numTinyDeallocations replicate_numSmallDeallocations replicate_numNormalDeallocations replicate_numHugeDeallocations replicate_numActiveAllocations replicate_numActiveTinyAllocations replicate_numActiveSmallAllocations replicate_numActiveNormalAllocations replicate_numActiveHugeAllocations replicate_numActiveBytes fetch_usedHeapMemory fetch_usedDirectMemory fetch_numHeapArenas fetch_numDirectArenas fetch_tinyCacheSize fetch_smallCacheSize fetch_normalCacheSize fetch_numThreadLocalCaches fetch_chunkSize fetch_numAllocations fetch_numTinyAllocations fetch_numSmallAllocations fetch_numNormalAllocations fetch_numHugeAllocations fetch_numDeallocations fetch_numTinyDeallocations fetch_numSmallDeallocations fetch_numNormalDeallocations fetch_numHugeDeallocations fetch_numActiveAllocations fetch_numActiveTinyAllocations fetch_numActiveSmallAllocations fetch_numActiveNormalAllocations fetch_numActiveHugeAllocations fetch_numActiveBytes -
namespace=CPU
Metric Name Description JVMCPUTime The JVM costs cpu time. -
namespace=system
Metric Name Description LastMinuteSystemLoad Returns the system load average for the last minute. AvailableProcessors The amount of system available processors. -
namespace=JVM
- This source provides information on JVM metrics using the Dropwizard/Codahale Metric Sets for JVM instrumentation and in particular the metric sets BufferPoolMetricSet, GarbageCollectorMetricSet and MemoryUsageGaugeSet.
-
namespace=ResourceConsumption
- notes:
- This metrics data is generated for each user and they are identified using a metric tag.
- This metrics also include subResourceConsumptions generated for each application of user and they are identified using
applicationIdtag.
Metric Name Description diskFileCount The count of disk files consumption by each user. diskBytesWritten The amount of disk files consumption by each user. hdfsFileCount The count of hdfs files consumption by each user. hdfsBytesWritten The amount of hdfs files consumption by each user. - notes:
-
namespace=ThreadPool
- notes:
- This metrics data is generated for each thread pool and they are identified using a metric tag by thread pool name.
Metric Name Description active_thread_count The approximate number of threads that are actively executing tasks. pending_task_count The pending task not executed in block queue. pool_size The current number of threads in the pool. core_pool_size The core number of threads. maximum_pool_size The maximum allowed number of threads. largest_pool_size The largest number of threads that have ever simultaneously been in the pool. is_terminating Whether this executor is in the process of terminating after shutdown() or shutdownNow() but has not completely terminated. is_terminated Whether this executor is in the process of terminated after shutdown() or shutdownNow() and has completely terminated. is_shutdown Whether this executor is shutdown. - notes:
Note:
The Netty DirectArenaMetrics named like push/fetch/replicate_numXX are not exposed by default, nor in Grafana dashboard.
If there is a need, you can enable celeborn.network.memory.allocator.verbose.metric to expose these metrics.
Setup Prometheus dashboard
- Install Prometheus (https://prometheus.io/). We provide an example for Prometheus config file:
# Prometheus example config
global:
  scrape_interval: 15s
  evaluation_interval: 15s

scrape_configs:
  - job_name: "Celeborn"
    metrics_path: /metrics/prometheus
    scrape_interval: 15s
    static_configs:
      - targets: [ "master-ip:9098","worker1-ip:9096","worker2-ip:9096","worker3-ip:9096","worker4-ip:9096" ]
-
Install Grafana server (https://grafana.com/grafana/download).
-
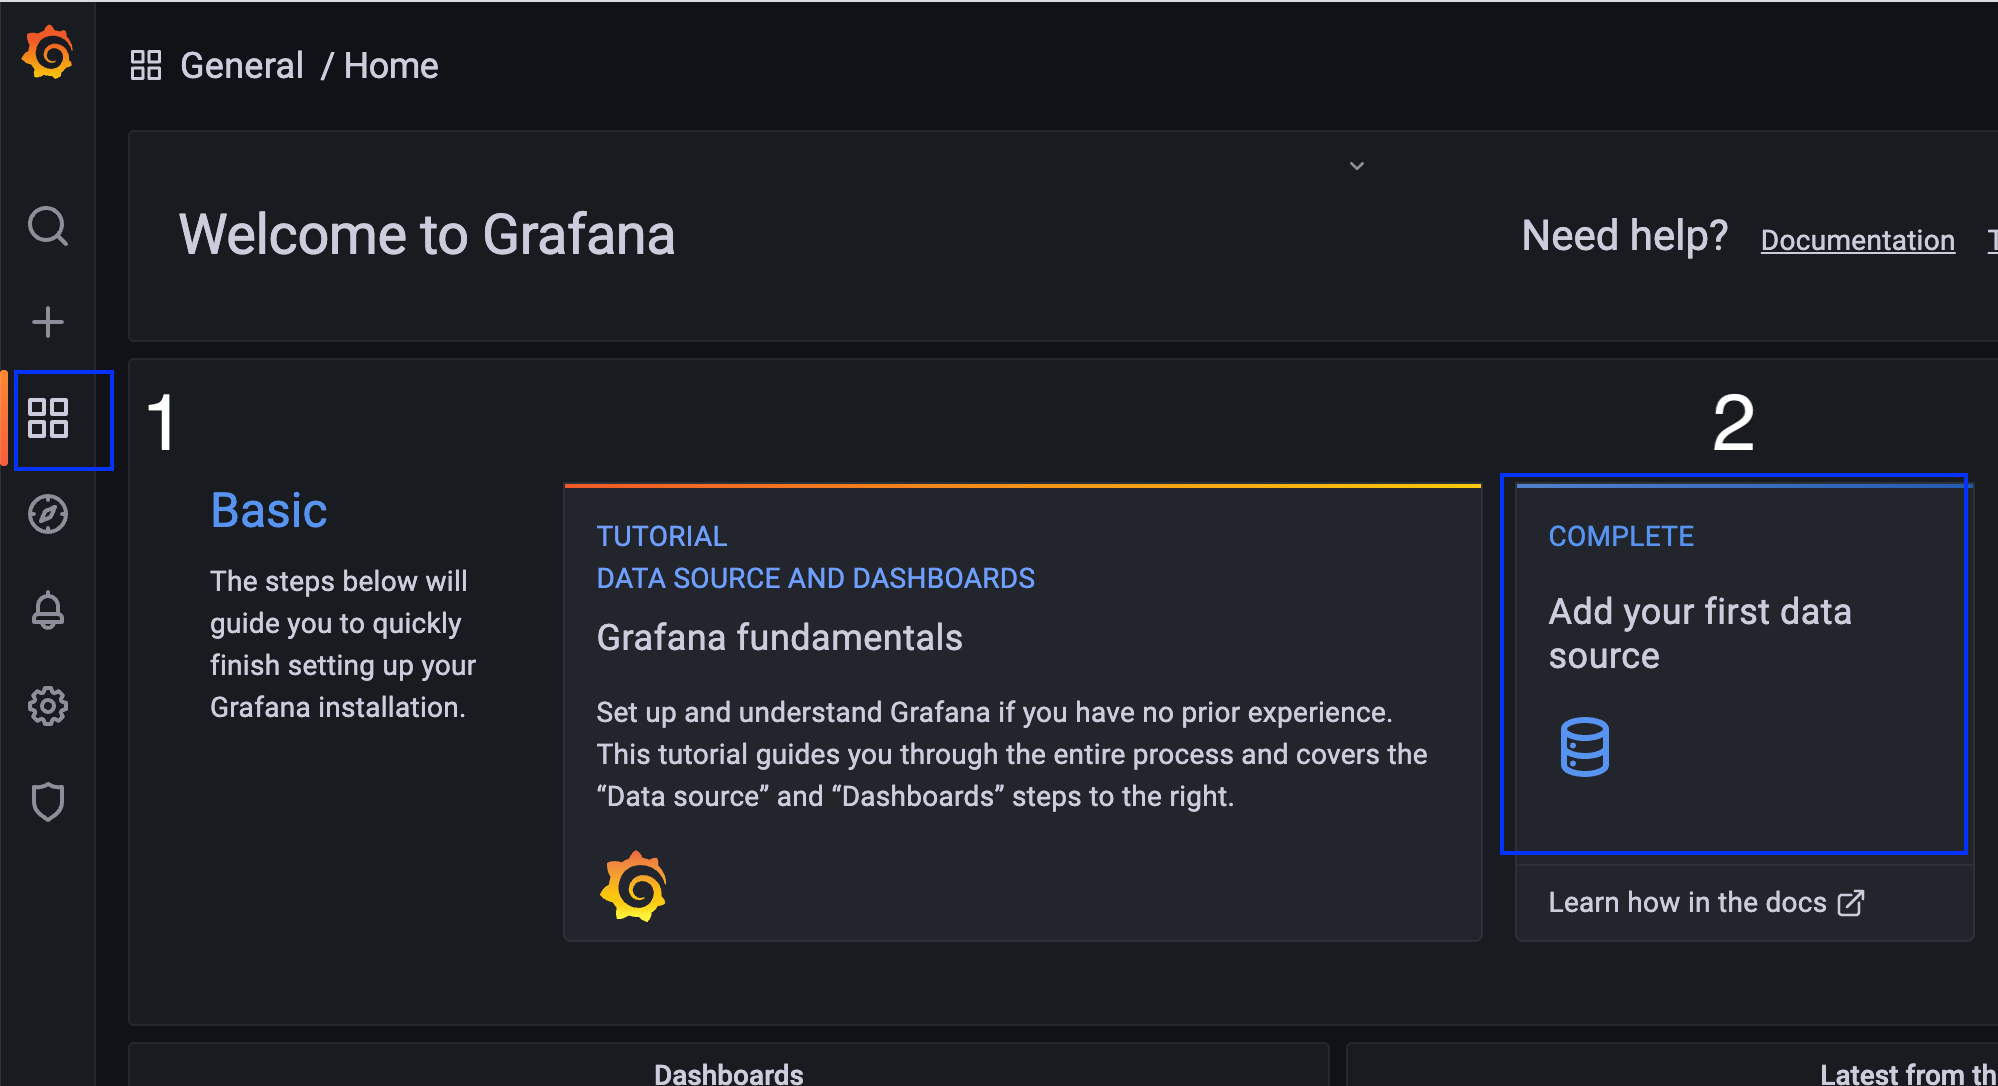
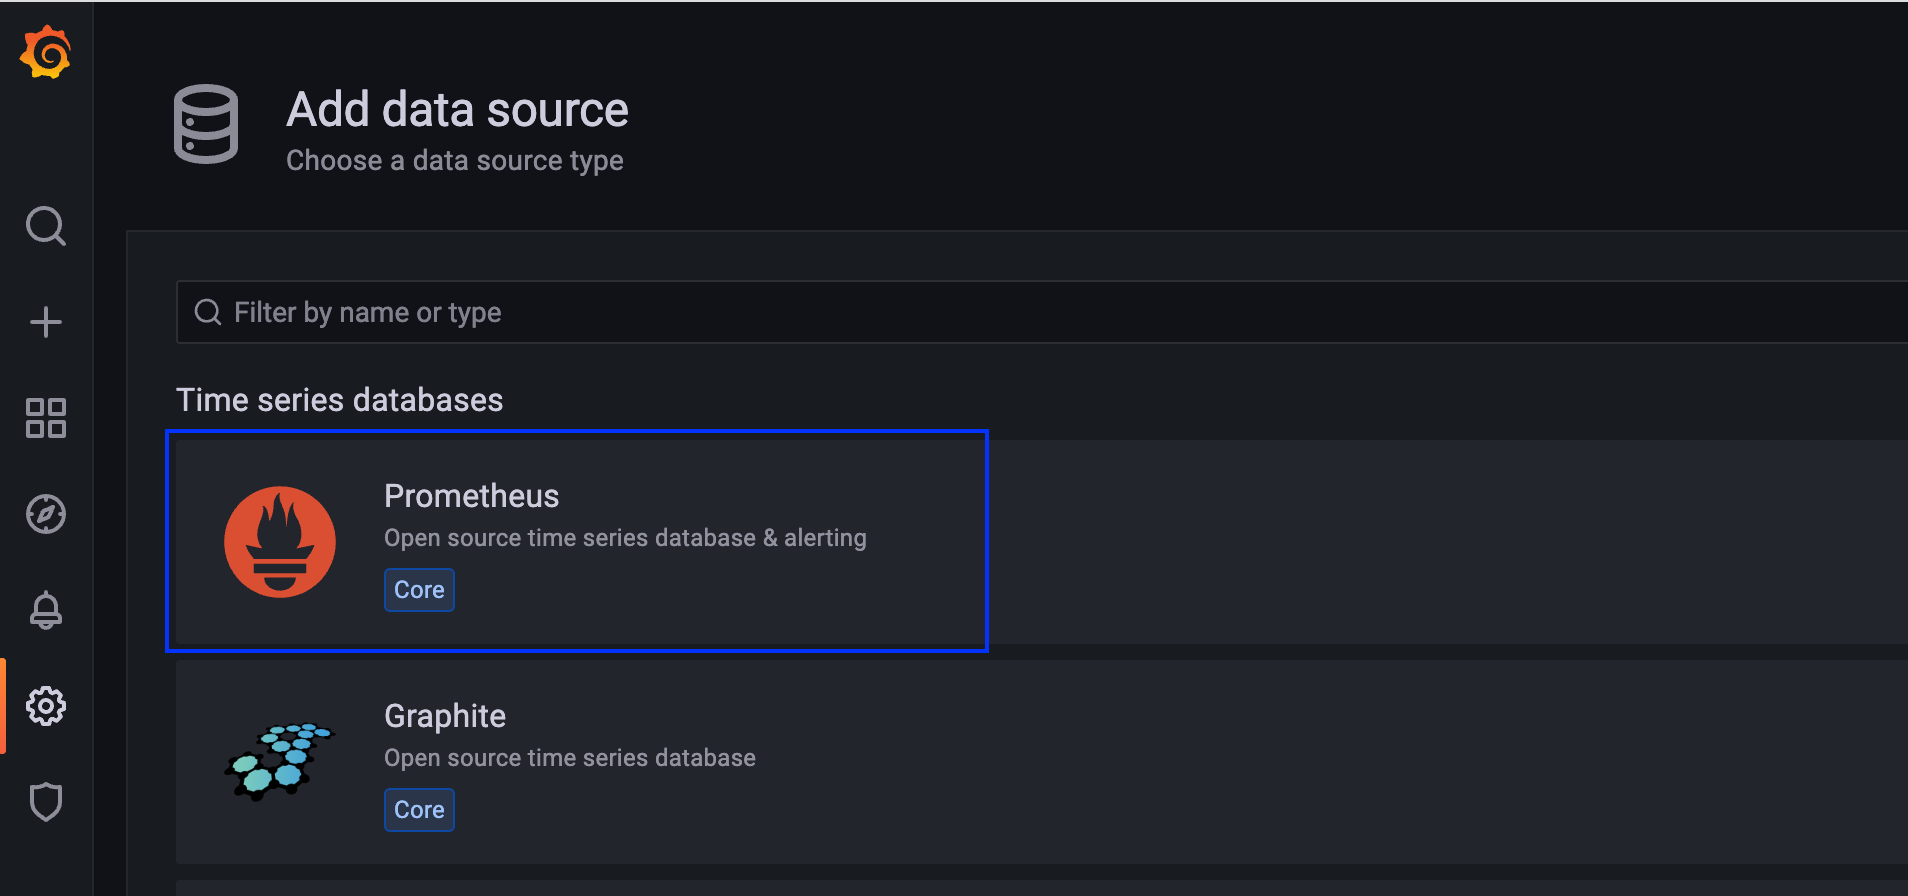
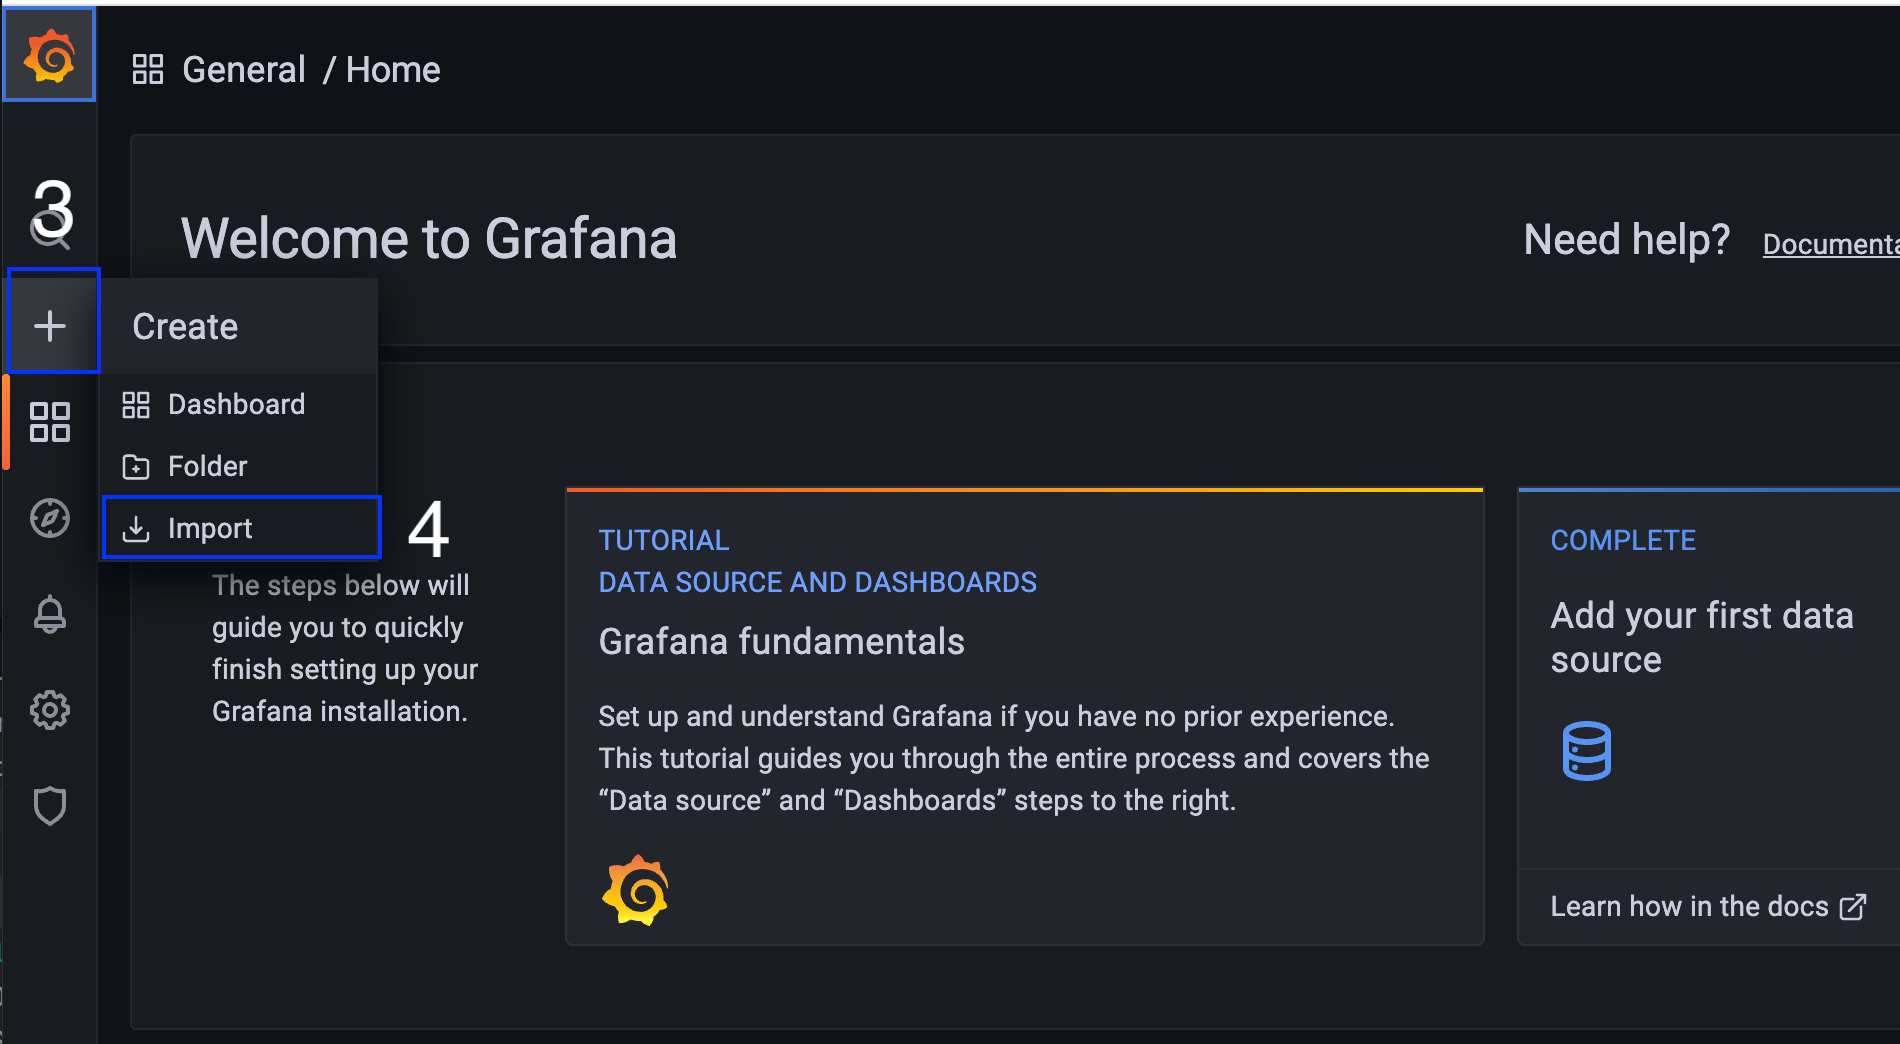
Import Celeborn dashboard into Grafana.
You can find the Celeborn dashboard templates under the assets/grafana directory.
celeborn-dashboard.json displays Celeborn internal metrics and celeborn-jvm-dashboard.json displays Celeborn JVM related metrics.
Here is an example of Grafana dashboard importing.


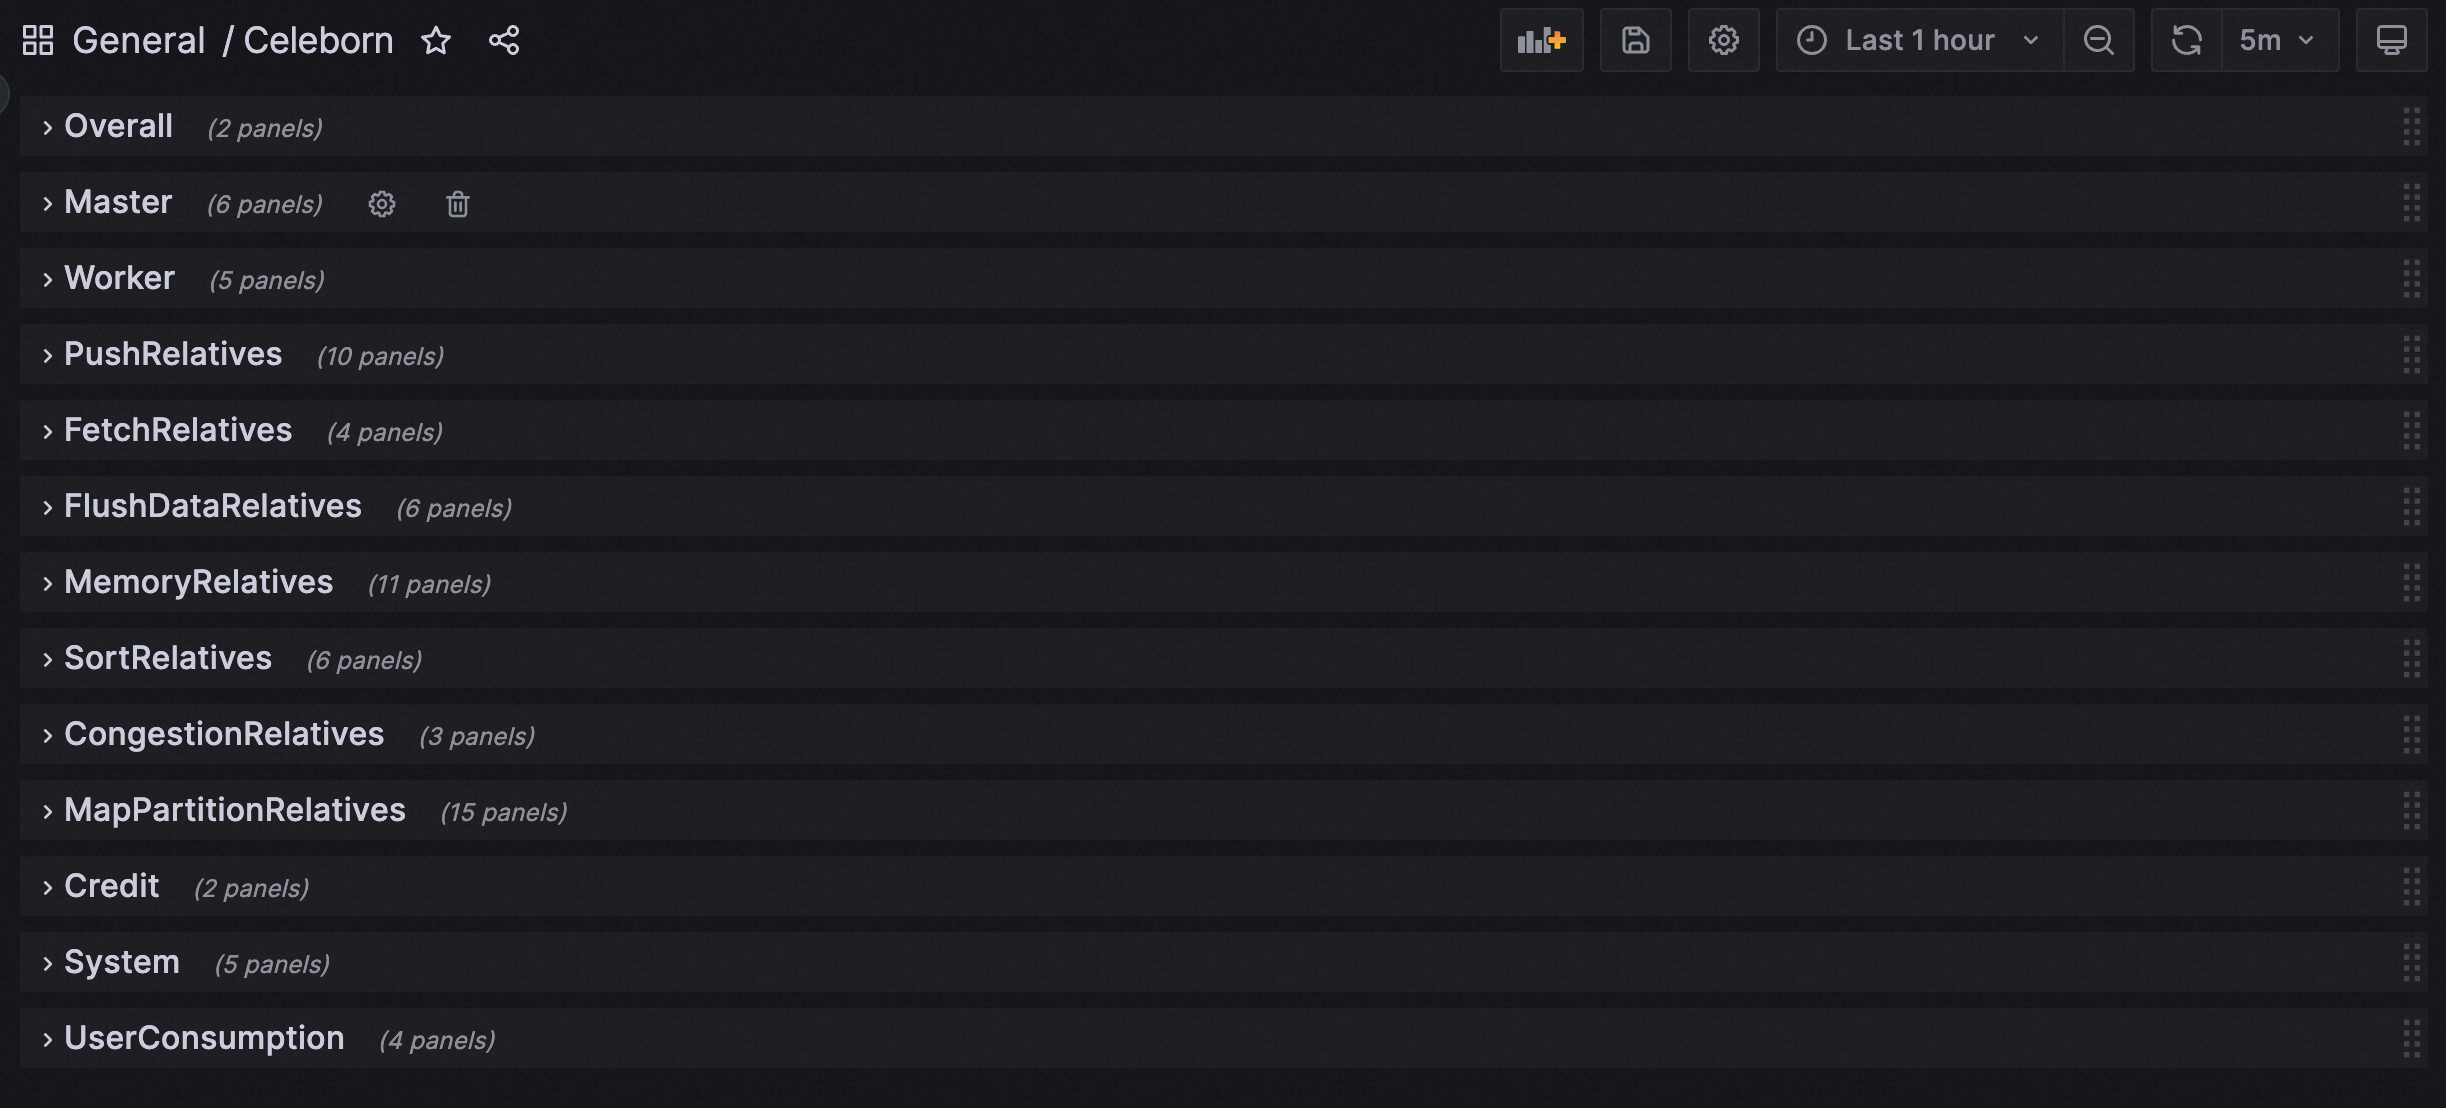
Here are some snapshots:

Optional
We recommend you to install node exporter (https://github.com/prometheus/node_exporter) on every host, and configure Prometheus to scrape information about the host. Grafana will need a dashboard (dashboard id:8919) to display host details.
global:
  scrape_interval: 15s
  evaluation_interval: 15s

scrape_configs:
  - job_name: "Celeborn"
    metrics_path: /metrics/prometheus
    scrape_interval: 15s
    static_configs:
      - targets: [ "master-ip:9098","worker1-ip:9096","worker2-ip:9096","worker3-ip:9096","worker4-ip:9096" ]
  - job_name: "node"
    static_configs:
      - targets: [ "master-ip:9100","worker1-ip:9100","worker2-ip:9100","worker3-ip:9100","worker4-ip:9100" ]
REST API
In addition to viewing the metrics, Celeborn also supports REST API. This gives developers an easy way to create new visualizations and monitoring tools for Celeborn and also easy for users to get the running status of the service.